

Key Takeaways
- A fund factsheet is a standardized summary of a fund's objective, past performance, charges, and holdings.
- Past performance figures show what happened historically and do not predict future returns.
- The ongoing charges figure (OCF) is the single most important cost number to check on any factsheet.
- Risk ratings are relative to other funds, not absolute measures of safety.
- Holdings and sector breakdowns reveal what you actually own when you invest in a fund.
What you will need
What a fund factsheet is and why it matters
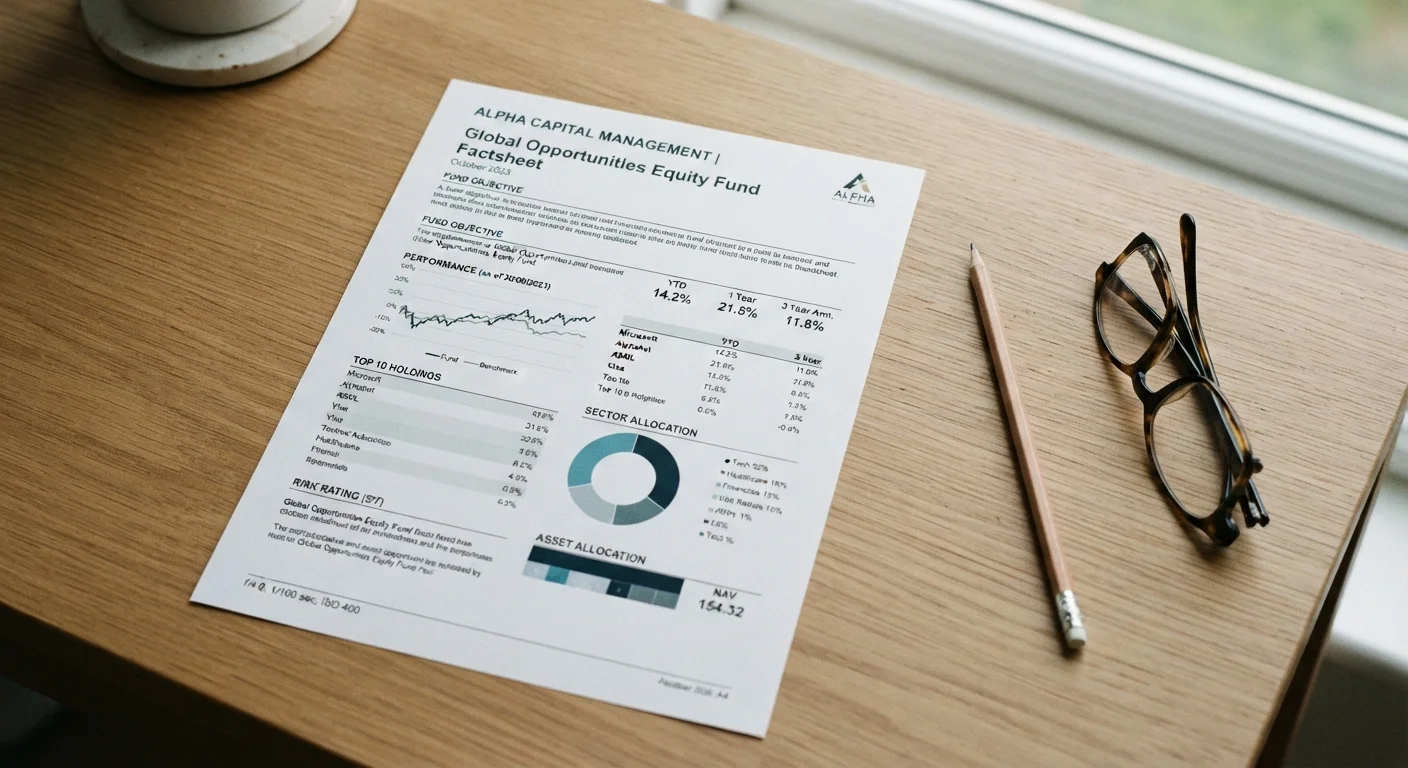
A fund factsheet is a one- or two-page document that fund managers publish, typically every month or quarter. Its purpose is to give investors a consistent snapshot of what a fund owns, how it has performed, and what it costs to hold. Regulators in the US and most developed markets require fund managers to produce standardized disclosure documents, and the factsheet is the accessible public-facing version of that obligation.
If you are comparing funds or trying to understand what your retirement account is actually invested in, the factsheet is your starting point. The challenge is that its layout can feel designed for financial professionals. The sections below decode each part in plain terms.
For a broader foundation on why holding investments over time matters, see why long-term thinking changes investment strategy before applying what you learn here.
How to read each section of the factsheet
Work through the factsheet in order. Each section answers a specific question about the fund.
Read the fund objective first
The fund objective (sometimes called the investment aim) is usually the first paragraph of any factsheet. It states what the fund is trying to do: grow capital, produce income, track an index, or some combination. This single sentence determines whether the fund is relevant to you at all.
Check whether the objective matches your goal. An income fund that pays regular dividends is structured differently from a growth fund that reinvests gains. Misaligning these from the start is one of the most common factsheet-reading errors.
Interpret the risk and reward indicator
Most factsheets display a numbered scale, typically 1 to 7, with 1 being lower risk and lower potential return, and 7 being higher risk and higher potential return. This is called the Synthetic Risk and Reward Indicator (SRRI) or a similar name depending on the regulatory framework. It is calculated from the fund's historical price volatility.
The number is a relative measure within a classification system, not an absolute statement about safety. A fund rated 4 can still lose money. The rating also changes over time as market conditions shift.
Examine the charges section carefully
Find the ongoing charges figure (OCF), sometimes labeled the total expense ratio (TER). This is the annual percentage of your investment deducted to cover fund management and administration. It is the most important cost number on the factsheet.
A typical passive index fund may carry an OCF below 0.20%. An actively managed fund often ranges from 0.60% to over 1.50%. Check whether the factsheet also discloses a performance fee, which is charged only when the fund exceeds a set benchmark. Performance fees are listed separately and can add meaningfully to total costs in strong market years.
Analyze the performance table
Performance figures are shown as percentage changes over set periods: one year, three years, five years, and sometimes ten years. Most factsheets show discrete annual returns year by year alongside cumulative figures.
Always read the fund's return alongside the benchmark return in the same row. A fund that returned 8% over five years looks less impressive if its benchmark returned 11% over the same period. Consistent underperformance relative to the benchmark is a signal worth investigating, not ignoring.
Past performance does not guarantee future results. This is not a legal formality; it reflects genuine uncertainty in markets.
Review the top holdings and sector breakdown
The holdings section lists the fund's largest individual positions, usually the top 10, along with each position's percentage of the total fund. The sector or geographic breakdown shows how the fund is distributed across industries or regions.
These two sections tell you what you actually own. If a fund holds 25% in a single stock or 60% in one country, you carry concentrated exposure to that asset even if the fund's name suggests broad diversification. Compare the holdings to any other funds you hold to avoid doubling up on the same assets without realizing it.
Note the fund size and manager tenure
The factsheet typically lists the fund's total assets under management (AUM). Very small funds, sometimes below $50 million, can carry liquidity risk: if many investors redeem at once, the fund may struggle to sell holdings at fair prices. Very large funds face a different constraint in that size can limit agility in certain markets.
Manager tenure matters for actively managed funds. If the stated performance record covers ten years but the current manager took over two years ago, the historical figures do not reflect that manager's decisions. Check the manager's start date against the performance table.
Keep a simple comparison sheet
When evaluating more than one fund, write down the OCF, benchmark, five-year performance gap versus that benchmark, and top three holdings for each. Placing these side by side makes differences that look small on individual factsheets much clearer. This habit also reduces the chance of holding two funds with nearly identical underlying assets.
This article is for informational purposes only and is not personalized financial advice. Consult a qualified financial adviser before making investment decisions based on your individual circumstances.
Common mistakes when interpreting factsheets
Two errors appear regularly among readers new to factsheets. The first is treating short-term performance as predictive. A fund that returned 30% in a single calendar year may have benefited from a favorable market cycle rather than exceptional management. Always look at five- or ten-year figures alongside the one-year number, and compare them to the benchmark the fund tracks.
The second mistake is ignoring charges. A difference of 0.5% in annual fees sounds minor, but over 20 years it compounds into a meaningful reduction in final wealth. Common errors new investors make covers fee blindness and other traps in more detail.
A third pattern worth noting: confusing a low risk rating with a guarantee of safety. A fund rated 3 out of 7 is lower risk relative to other funds in that classification system, not risk-free. Capital can still fall in value, particularly over short holding periods.
Putting the factsheet in context
A factsheet answers historical questions. It cannot tell you whether a fund is right for your goals, tax situation, or time horizon. Once you understand the numbers, the next step is matching them to your own circumstances, ideally with the help of a licensed financial adviser.
If you want to understand one of the most common fund structures you will encounter on factsheets, how passive investing works and its trade-offs is a useful companion read. And if you are building general financial literacy alongside your investing knowledge, the saving and debt hub covers the broader picture of managing money before it reaches a fund.